Skip to main content
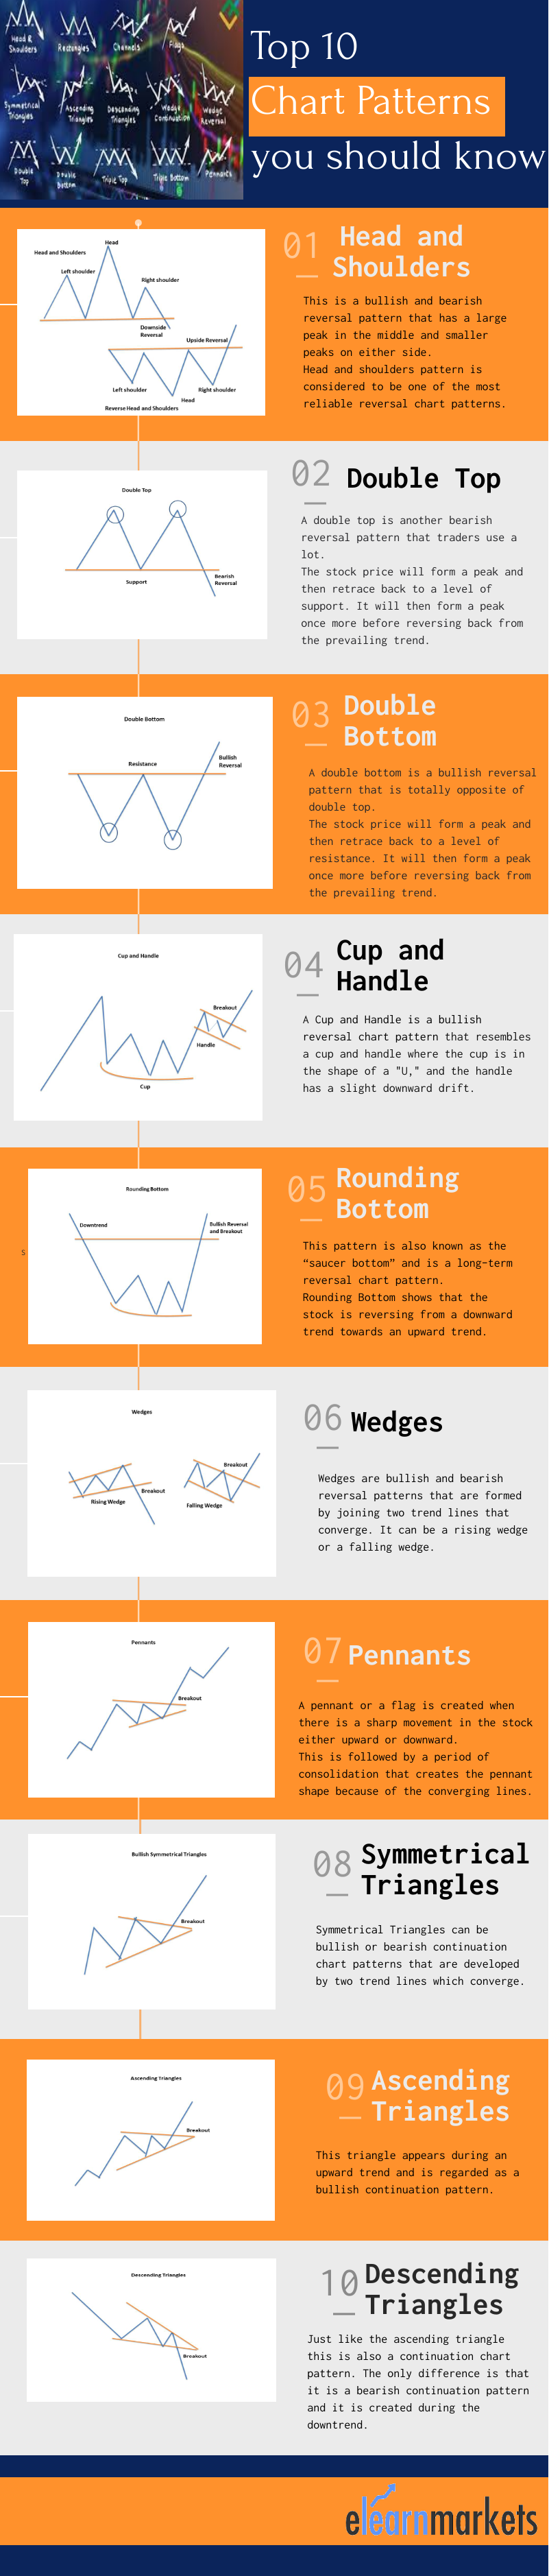
- Chart patterns can be basically classified into:
- Continuation patterns: These kinds of chart patterns give continuation signals of the ongoing trend
- Reversal Patterns: These kinds of chart patterns give reversal signals
- Bilateral Patterns: These kinds of chart patterns shows uncertainty and high volatility in the market.
- Here are the 10 most useful chats patterns which will help you in trading:
- This is a bullish and bearish reversal patterns which has a large peak in the middle and smaller peaks on the either sides.
- Head and shoulders pattern is considered to be one of the most reliable reversal chart patterns.
- This pattern is formed when the prices of the stock rises to a peak and falls down to the same level from where it had started rising.
- Again the prices rises and form a peak higher than the last peak and again it declines to the original base.
- Prices again rise to form a third peak, which is lower than the second peak and from here it starts declining to the base level.
- When the prices break the baseline with volume then bearish reversal takes place.
- For understanding Trading Strategies and the performance of stocks forming Bullish Head & Shoulder Pattern patterns,
- A double top is another bearish reversal pattern that traders use a lot.
- The stock price will form a peak and then retrace back to a level of support. It will then form a peak once more before reversing back from the prevailing trend.
- A double bottom is bullish reversal pattern that is totally opposite of double top.
- The stock price will form a peak and then retrace back to a level of resistance. It will then form a peak once more before reversing back from the prevailing trend.
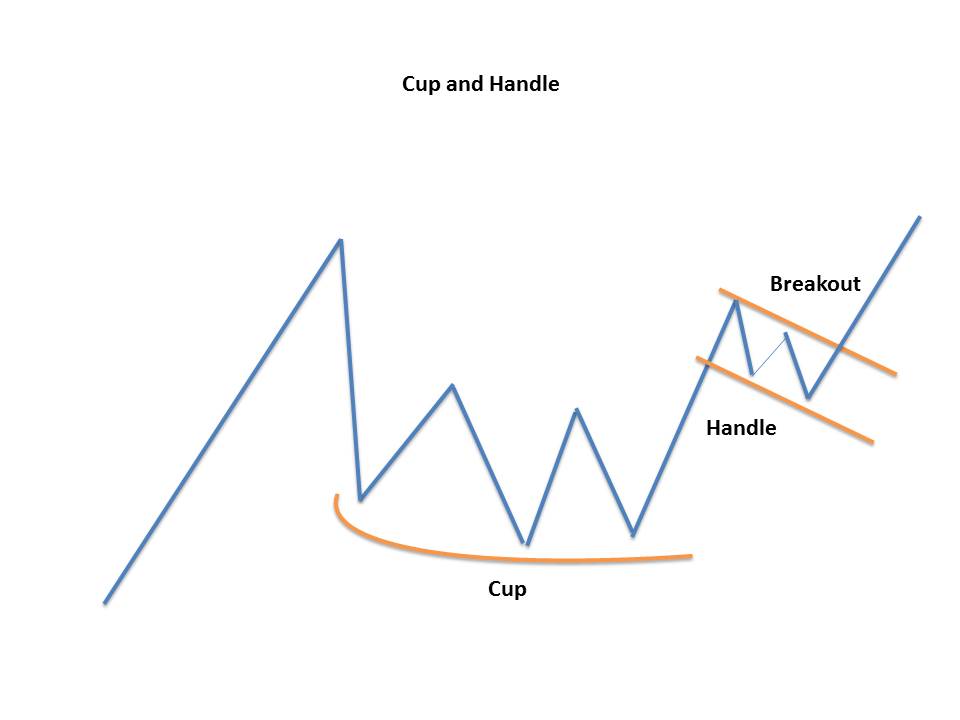
- A cup and handle is a bullish reversal chart pattern which resembles a cup and handle where the cup is in the shape of a “U” and the handle has a slight downward drift.
- The cup appears similar to a rounding bottom chart pattern, and the handle is similar to a wedge pattern.
- The right-hand side of the pattern has low trading volume that may be as short as seven weeks or as long as 65 weeks.
- This pattern is also known as the “saucer bottom” and is long-term reversal chart pattern.
- It can take any time from several months to years to form. It is very similar to the cup and handle, but the only difference is that there is no handle to the pattern.
- Wedges are bullish and bearish reversal as well as continuation patterns which are formed by joining two trend lines which converge. It can be a rising wedge or a falling wedge.
- Rising wedge occurs when the price of the stock is rising over a time whereas falling wedge occurs when the price of the stock is falling over a time.
- Wedge pattern can be drawn by using trend lines and connecting the peaks and the troughs.
- Once there is price breakout, there is a sharp movement of prices in either of the directions.
- For understanding Trading Strategies and the performance of stocks forming Falling Wedge patterns,
- A pennant pattern or a flag pattern is created when there is a sharp movement in the stock either upward or downward.
- This is followed by a period of consolidation that creates the pennant shape because of the converging lines.
- Then a breakout movement occurs in the same direction as the big stock move. Pennants patterns are similar to flag patterns and tend to last between one and three weeks.
- At the initial stock movement there is a significant volume which is followed by weaker volume in the pennant section, and then rise in the volume at the breakout.
- 8. Symmetrical Triangles:
- Symmetrical Triangles can be bullish or bearish continuation chart patterns that are developed by two trend lines which converge.
- These two trend lines join the peaks and troughs and they occur in the direction of the ongoing trend.
- For understanding Trading Strategies and the performance of stocks forming Symmetrical Triangle patterns,
- This triangle appears during an upward trend and is regarded as a bullish continuation pattern.
- Sometimes it can be also created at the end of a downward trend as a reversal pattern, but it more commonly considered as a continuation chart pattern.
- Ascending triangles are always regarded as bullish patterns whenever they are formed in the charts.
- For understanding Trading Strategies and the performance of stocks forming Ascending Triangle patterns,
- 10. Descending Triangles:
- Just like the ascending triangle, the descending triangle is also a continuation chart pattern. The only difference is that it is a bearish continuation pattern and it is created during the downtrend.
- Sometimes it can be also created at the end of an uptrend as a reversal pattern, but it more commonly considered as a continuation chart pattern.
- For understanding Trading Strategies and the performance of stocks forming Descending Triangle patterns,
- How to use Chart Patterns Scanners in StockEdge?
- StockEdge has developed a deeper analysis of stock charts and has developed this unique feature to identify some key chart patterns in StockEdge charts for you; where you will receive a list of stocks where respective chart patterns have recently formed, allowing you to capitalize on trade opportunities as soon as a chart pattern is formed.
- The StockEdge Pro version has five categories of chart patterns. There are 12′ unique chart pattern types covering bullish, bearish, and neutral momentum:
- After clicking on any of the above chart patterns, you will get a list of different types of that particular chart pattern, for example when we click on Triangle patterns, we will get the list as shown below:
- To get the list of stocks exhibiting a particular type of chart pattern, click on the name of that chart pattern:
- By clicking on the stock’s name, the stock chart will be shown below:


Comments
Post a Comment